Note | Regression Analysis and Final Project

This is a note of the Course Statistics for Data Science with Python in week 5 and week 6.
We will use regression analysis to describe the relationship between one set of variables(the dependent variables), and another set of variables(the independent or explanatory variables)^1 and accomplish the final project with the Boston house dataset.
When there is only one explanatory variable, it is called simple regression.
We will use regression analysis instead of the t-test, ANOVA, and correlation. Details about linear model.
Import libraries
import numpy as np
import pandas as pd
import statsmodels.api as sm
Fetch data
ratings_url = 'https://cf-courses-data.s3.us.cloud-object-storage.appdomain.cloud/IBMDeveloperSkillsNetwork-ST0151EN-SkillsNetwork/labs/teachingratings.csv'
ratings_df = pd.read_csv(ratings_url)
Regression with T-test
Question:
Using the teachers rating data set, does gender affect teaching evaluation rates?
State the hypothesis:
- H0: Gender has no effect on teaching evaluation scores
- H1: Gender has an effect on teaching evaluation scores
The alpha level is 0.05.
## X is the input variables (or independent variables)
X = ratings_df['female']
## y is the target/dependent variable
y = ratings_df['eval']
## add an intercept (beta_0) to our model
X = sm.add_constant(X)

model = sm.OLS(y, X).fit()
predictions = model.predict(X)

# Print out the statistics
model.summary()
Results: R-squared: 0.022, F-statistic: 10.56, Prob (F-statistic): 0.00124
Conclusion: Like the t-test, the p-value is less than the alpha (α) level, so we reject the null hypothesis.
There is significant evidence to prove that there is a difference in mean evaluation scores based on gender.
"The coefficient -0.1680 means that females get 0.168 scores less than men."
OLS is the ordinary least squares(OLS).
Regression with ANOVA
Question: Using the teachers' rating data set, does beauty score for instructors differ by age?
We group the data into 3 age groups, and state the hypothesis.
- H0: u1=u2=u3, the three population means are equal
- H1: At least one of the means differ
# Seperate
ratings_df.loc[(ratings_df['age'] <= 40), 'age_group'] = '40 years and younger'
ratings_df.loc[(ratings_df['age'] > 40)&(ratings_df['age'] < 57), 'age_group'] = 'between 40 and 57 years'
ratings_df.loc[(ratings_df['age'] >= 57), 'age_group'] = '57 years and older'

# Regression
from statsmodels.formula.api import ols
lm = ols('beauty ~ age_group', data = ratings_df).fit()
table= sm.stats.anova_lm(lm)
print(table)
The p-value = 4.322549e-08, we will reject the null hypothesis. There is significant evidence that at least one of the means differs.
Correlation
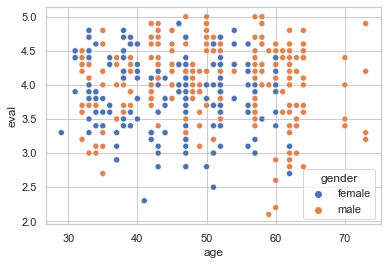
Question: Using the teachers' rating data set, what is the correlation between the number of students who participated in the evaluation survey and evaluation scores?
X = ratings_df['students']
y = ratings_df['eval']

X = sm.add_constant(X)
model = sm.OLS(y, X).fit()
predictions = model.predict(X)

model.summary()
R-squared: 0.001, R is math.sqrt(0.001) which is about 0.03. The correlation coefficient is 0.03. So there is a very weak correlation between the number of students who participated in the evaluation survey and evaluation scores
Here is the source code.
Final project
Project Scenario: You are a Data Scientist with a housing agency in Boston MA, you have been given access to a previous dataset on housing prices derived from the U.S. Census Service to present insights to higher management. Based on your experience in Statistics, what information can you provide them to help with making an informed decision? Upper management will like to get some insight into the following.
- Is there a significant difference in the median value of houses bounded by the Charles river or not?
- Is there a difference in median values of houses of each proportion of owner-occupied units built before 1940?
- Can we conclude that there is no relationship between Nitric oxide concentrations and the proportion of non-retail business acres per town?
- What is the impact of an additional weighted distance to the five Boston employment centers on the median value of owner-occupied homes?
Here are the solutions.
Next, I will go through Data Science For Beginnersof MS and the book named Introduction to Probability for Data Science
Change Log
2022-04-28 Jeremy initialized.